
The US and China port fees return on 9 November. Here is what four weeks of them did last time.
Analysis. Maritime Data Platform port call data, June 2025 to August 2026. Voyages: Marine Benchmark.
On 9 November the pause on US and Chinese port fees expires (Sourcing Journal). The fees were live for four weeks last autumn. That is the only time both sides have charged each other's ships at once, so we went back to the port call data to see what those four weeks did, and then compared the market then with the market now.
What happened last time
The US Trade Representative announced port fees on Chinese-built, Chinese-owned and Chinese-operated vessels in April 2025, effective 14 October 2025 (White & Case). China answered the same week with a levy on US-linked ships, starting at 400 yuan per net tonne. On 10 November both sides paused for a year (Vedder Price).
Containers: the share fell and came back
We looked at every container call at US deep sea ports and asked what proportion was made by a Chinese-built ship. Build country is a fixed fact about a vessel, and it is the criterion the US fee reached furthest with.
We used Singapore, Antwerp and Hamburg as a control set. Neither fee applied there, so if the share had fallen there too, the fees would not be the reason.
Before (to 13 Oct) | Fees in force (14 Oct to 9 Nov) | After (from 10 Nov) | |
US deep sea ports | 22.8% | 19.3% | 23.6% |
Singapore, Antwerp and Hamburg | 31.1% | 31.5% | 32.4% |
The Chinese-built share of US container calls fell 3.5 points during the four weeks, then returned to where it started once the fees were paused. At Singapore, Antwerp and Hamburg, where neither fee applied, the share did not move. The fee window covers 1,131 US container calls.

Tankers and dry bulk at US ports moved the same way, down 4.1 and 4.0 points, and both recovered after the pause. We are not leading with them because the comparison ports carry far fewer tanker and bulk calls a week, so the control is too noisy at weekly resolution to stand on its own.
Ownership, as a separate test
Build country is one way the rules reach a ship. They also reach it by who owns and operates it, and those are recorded in different fields that have nothing to do with where a ship was built. So we ran the same three periods against the ownership records as an independent check.

The China and Hong Kong share of US port calls fell on beneficial owner, operator and manager alike while the fees were live, and recovered on all three afterwards. At Singapore, Antwerp and Hamburg the beneficial owner share sat at 11.4%, 11.7% and 11.0% across the same three periods. Two definitions, same result.
The ships themselves
A share can move because ships stayed away or because other ships turned up. Those look the same in a share and mean different things, so we followed the vessels.
We took every ship that called a US port between June and September 2025 and was Chinese-built, Chinese-owned or Chinese-operated on any of the fields above, 1,066 vessels in all. This combines both definitions, so it adds nothing to the two tests above as evidence. It is there to answer a different question: did the same ships stop coming. Against them we set 1,034 ships with no China link on any field, matched on type and size.
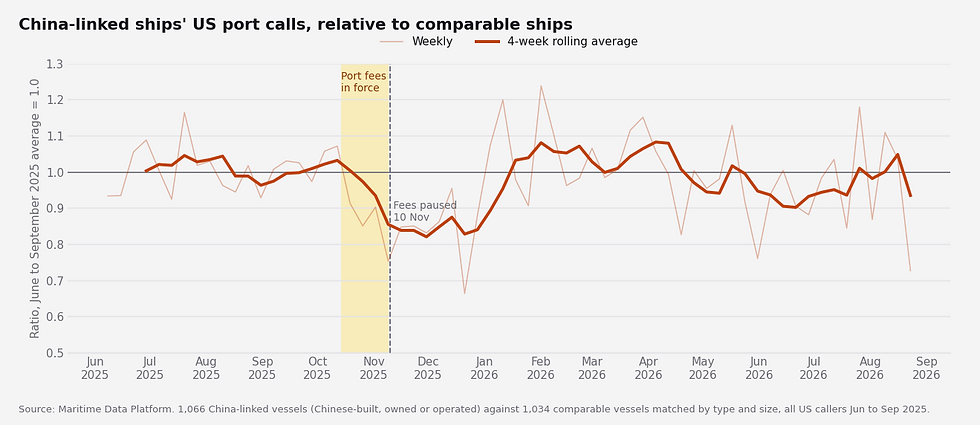
We compared the two groups week by week, each against its own summer average. When the line sits at 1.0 the China-linked ships are calling US ports at the same rate as comparable ships. Through the summer it did. From mid-October it fell, bottoming at 0.82, and stayed below 1.0 until early January. At its widest, China-linked ships were making about 18% fewer US calls than comparable ships. The ships left.
Then and now
Four things are different now. Both fee schedules step up each year, so the cost is higher than it was in October 2025. China's rate rose from 400 to 640 yuan per net tonne in April 2026 and the US schedule escalates on the same annual pattern (White & Case). Owners have had twelve months' notice and a worked example, where last time they had six months and no example. The Chinese-built share of the fleet calling US ports is higher than it was before the fees, 23.6% against 22.8% in containers and 17.9% against 15.3% in tankers. And last time the fees were paused after four weeks, so the market may have treated them as temporary from the start.
Last autumn the fleet responded within weeks and reverted just as fast. The market it would be responding to in November is not the same one.
We will run the same cuts again in December.
Port call data: Maritime Data Platform. Voyages: Marine Benchmark. All figures exclude vessels with no IMO match to the fleet register, which removes coastal and inland tonnage. Comparison port figures exclude Handysize tankers, as changes to the feed from June 2026 increased coverage of that segment and would distort the comparison. This has no effect on the container, dry bulk or MR-and-larger tanker series.


Comments